Ph.D. Candidate in Finance
Valerii Baidin
Desautels Faculty of Management, McGill University
M.A. in Economics, New Economic School
I study asset pricing and the investor decisions behind it. My research focuses on investment horizons in asset pricing, how investors’ subjective beliefs affect their portfolios and trading, and how price information, in turn, influences those beliefs. Beyond that, my interests extend to international finance and macroeconomics.

Research
Working Papers
-
Job market paper
The Missing Horizon in Asset Pricing
Best Paper Award (Finance), 2025 Symposium of the Montreal Joint Program in Business Administration
Presentations FMA Annual Meeting 2026 (regular session) · FMA Special PhD Paper Presentation 2026 · FMA Doctoral Student Consortium 2026 · NFA 2026 (poster session) · Boca Finance Conference (FAU) 2026 · Colloque doctoral en finance 2026, ESG UQAM · McGill PhD Conference 2026 · HEC Montréal 2026 · Queen’s University (Smith) 2026 · UQAM 2025
![Expected Euler term E[MR] against the horizon h in quarters. The blue curve equals one at h' = 4 with positive slope; the orange curve touches one at h* = 11 with zero slope.](public/value-matching-smooth-pasting.png)
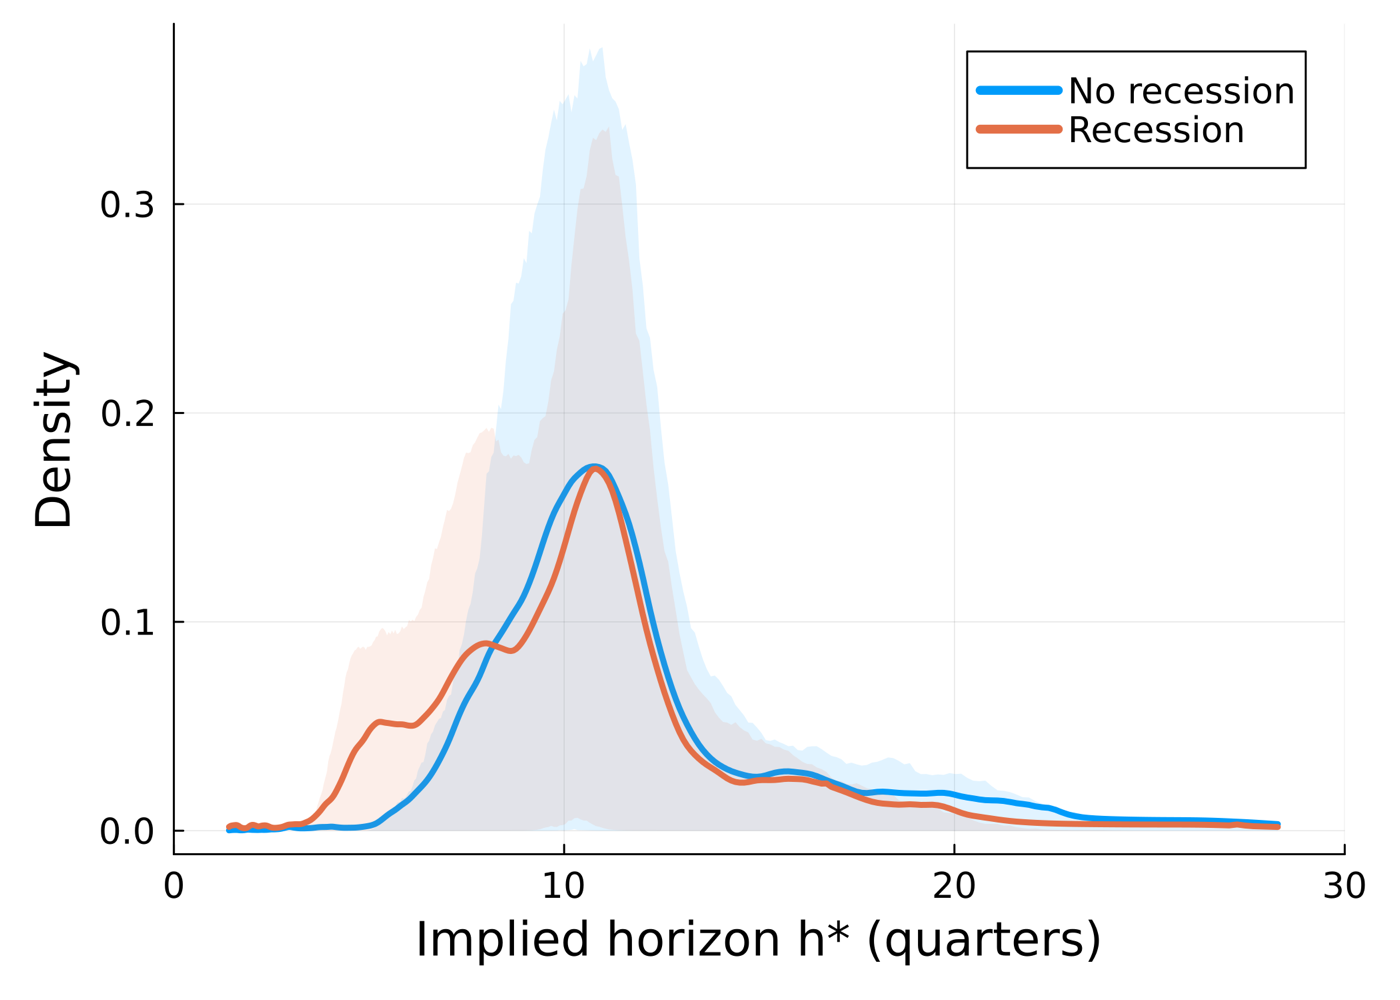
Implied investment horizon h* (quarters), expansions vs. recessions. 1 / 2Abstract
Investors choose how much to invest and for how long; in contrast, standard models fix the holding period and solve only for the amount. I introduce the choice of investment horizon into an asset pricing model. The optimality condition is the Horizon-Adjusted Fundamental Pricing Equation: the Euler equation holds at the investor’s chosen horizon, and its derivative with respect to the horizon is zero. When investors have long horizons but econometricians assume short ones, this mismatch leads to biased estimates of investors’ risk preferences. Comparative statics show that more risk-averse investors choose shorter horizons. Empirically, I estimate investment horizons from subjective beliefs recovered nonparametrically. Assuming beliefs are time-consistent and satisfy transitivity, I conduct a quasi-test of two identical investors with short or long possible horizons. The most likely horizon ranges from eight to fourteen quarters in normal times and from five to eight quarters in recessions, substantially longer than conventionally assumed. Implied risk aversion decreases sixfold as the horizon lengthens and stabilizes beyond eight quarters, sharply mitigating the equity premium puzzle. Horizon heterogeneity also helps explain portfolio composition: growth stocks match short horizons and value stocks match long ones.
-
Explaining Investor Portfolios, Trades and Performance Using Heterogeneous Beliefs and Risk Preferences
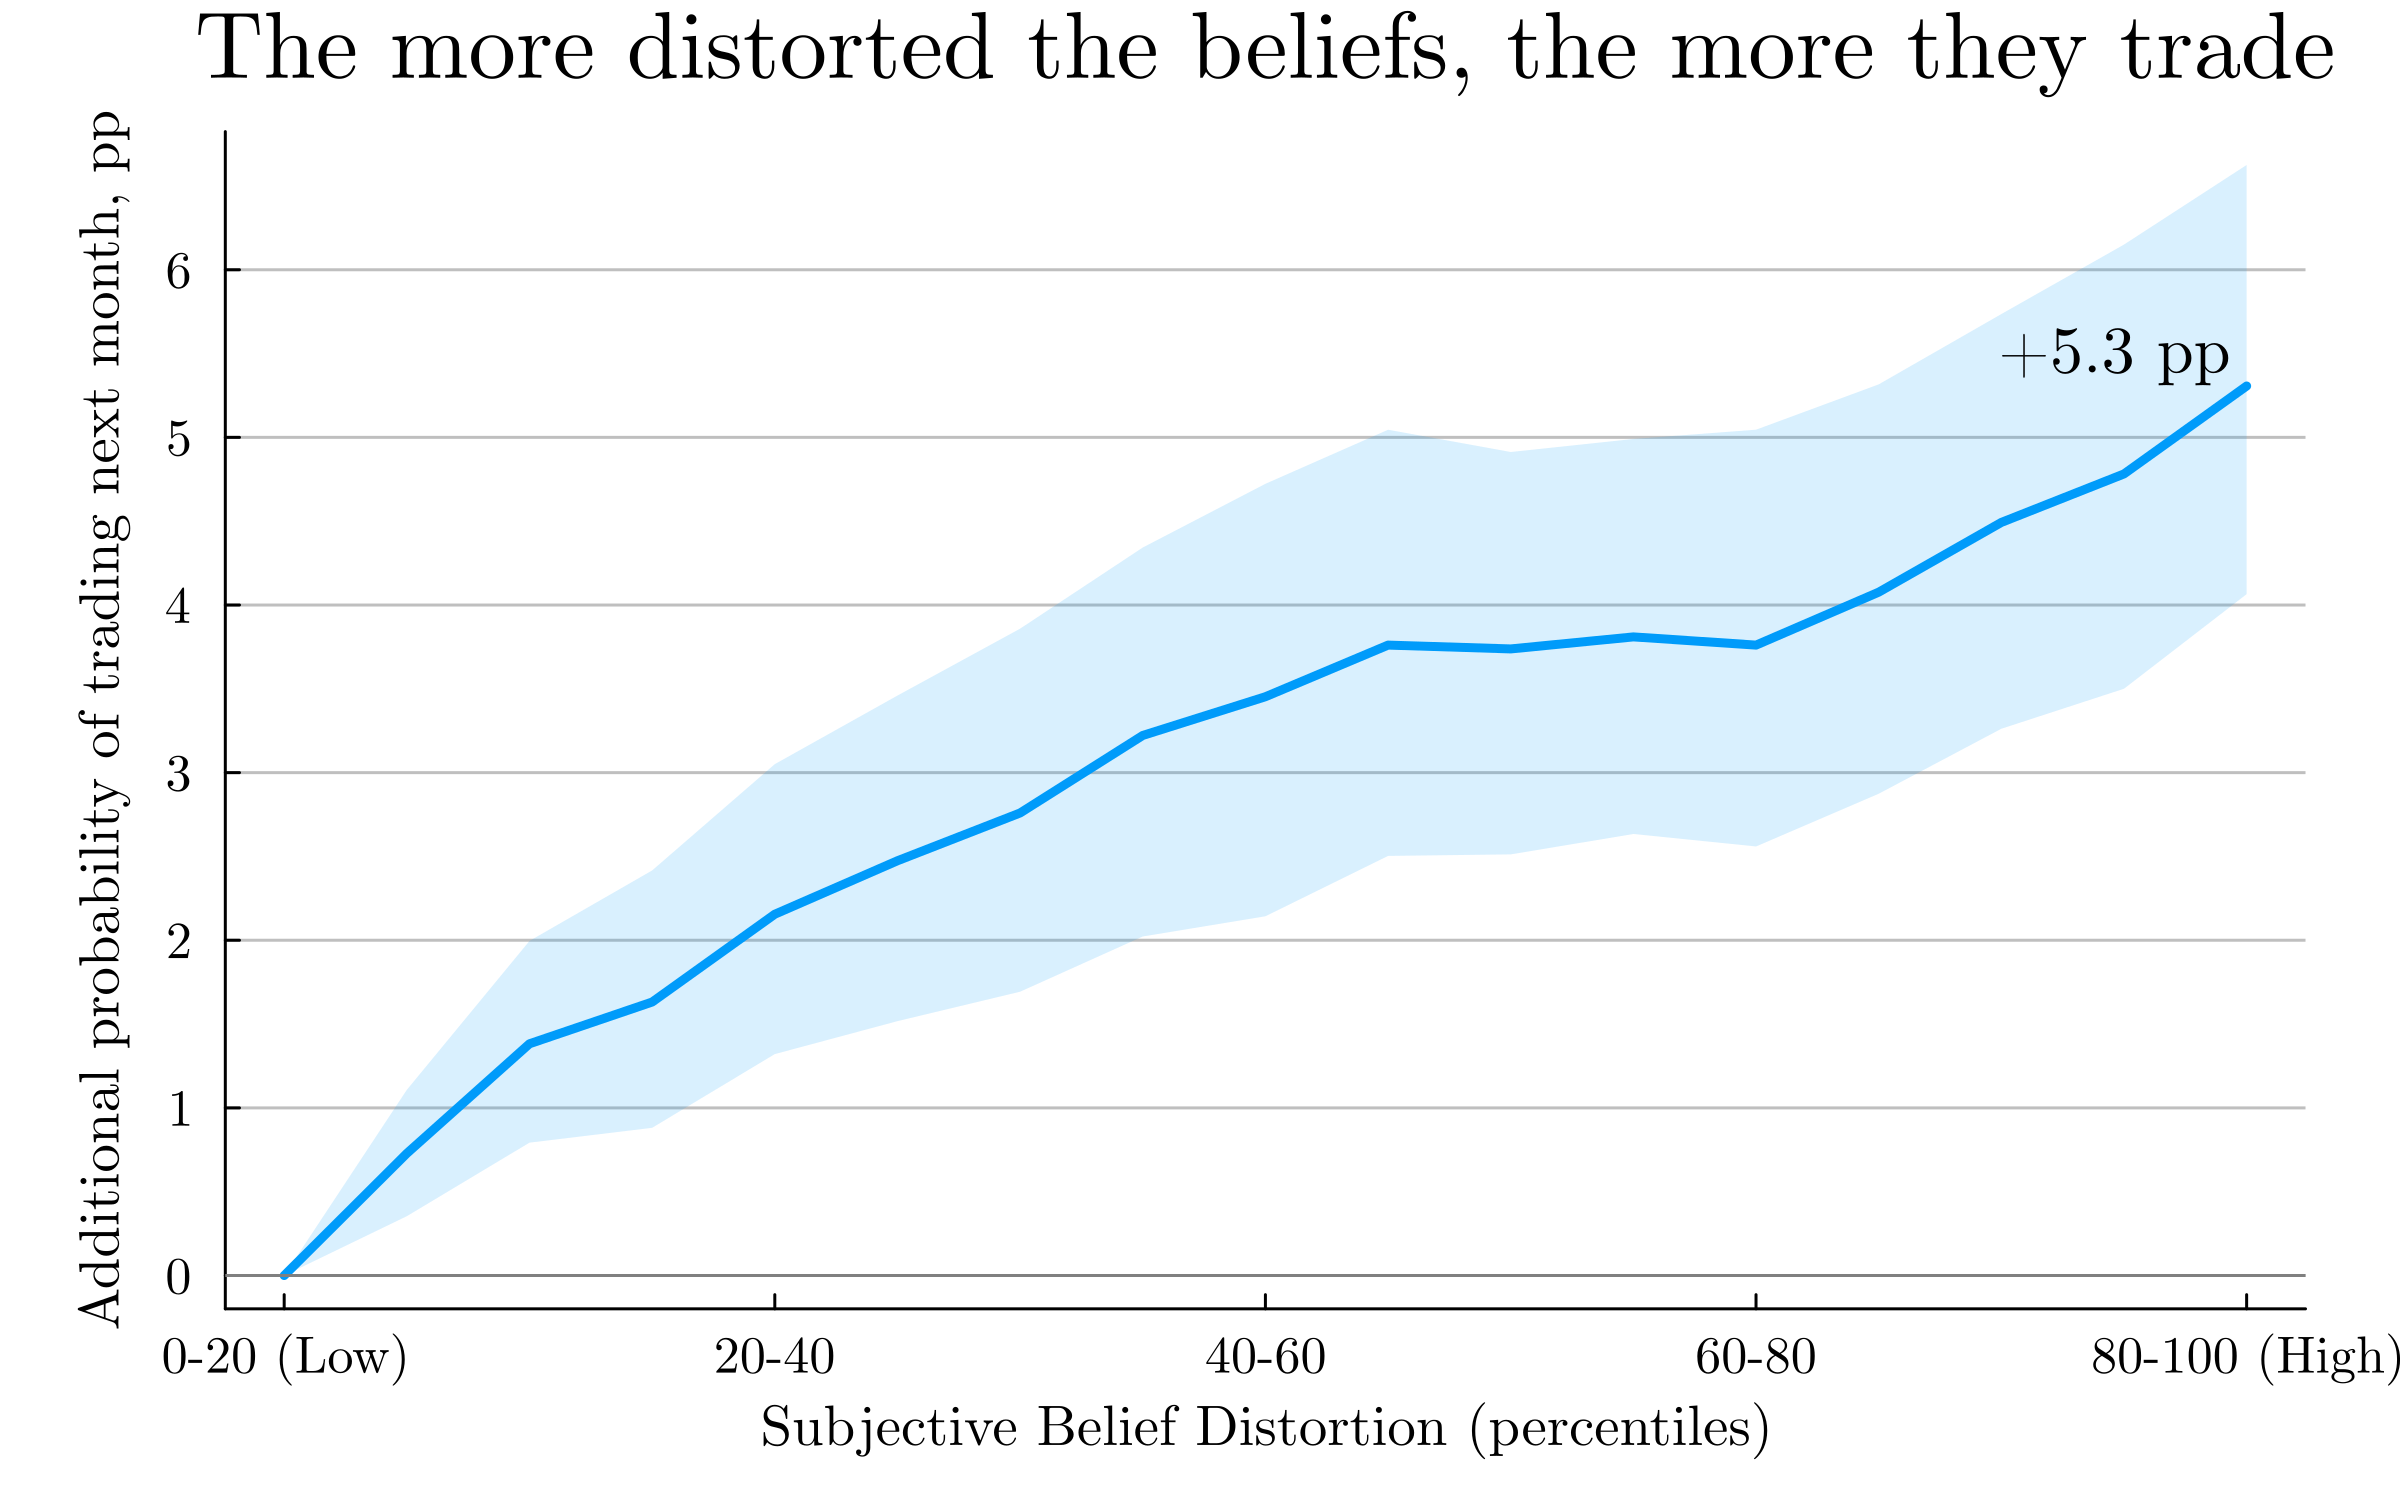
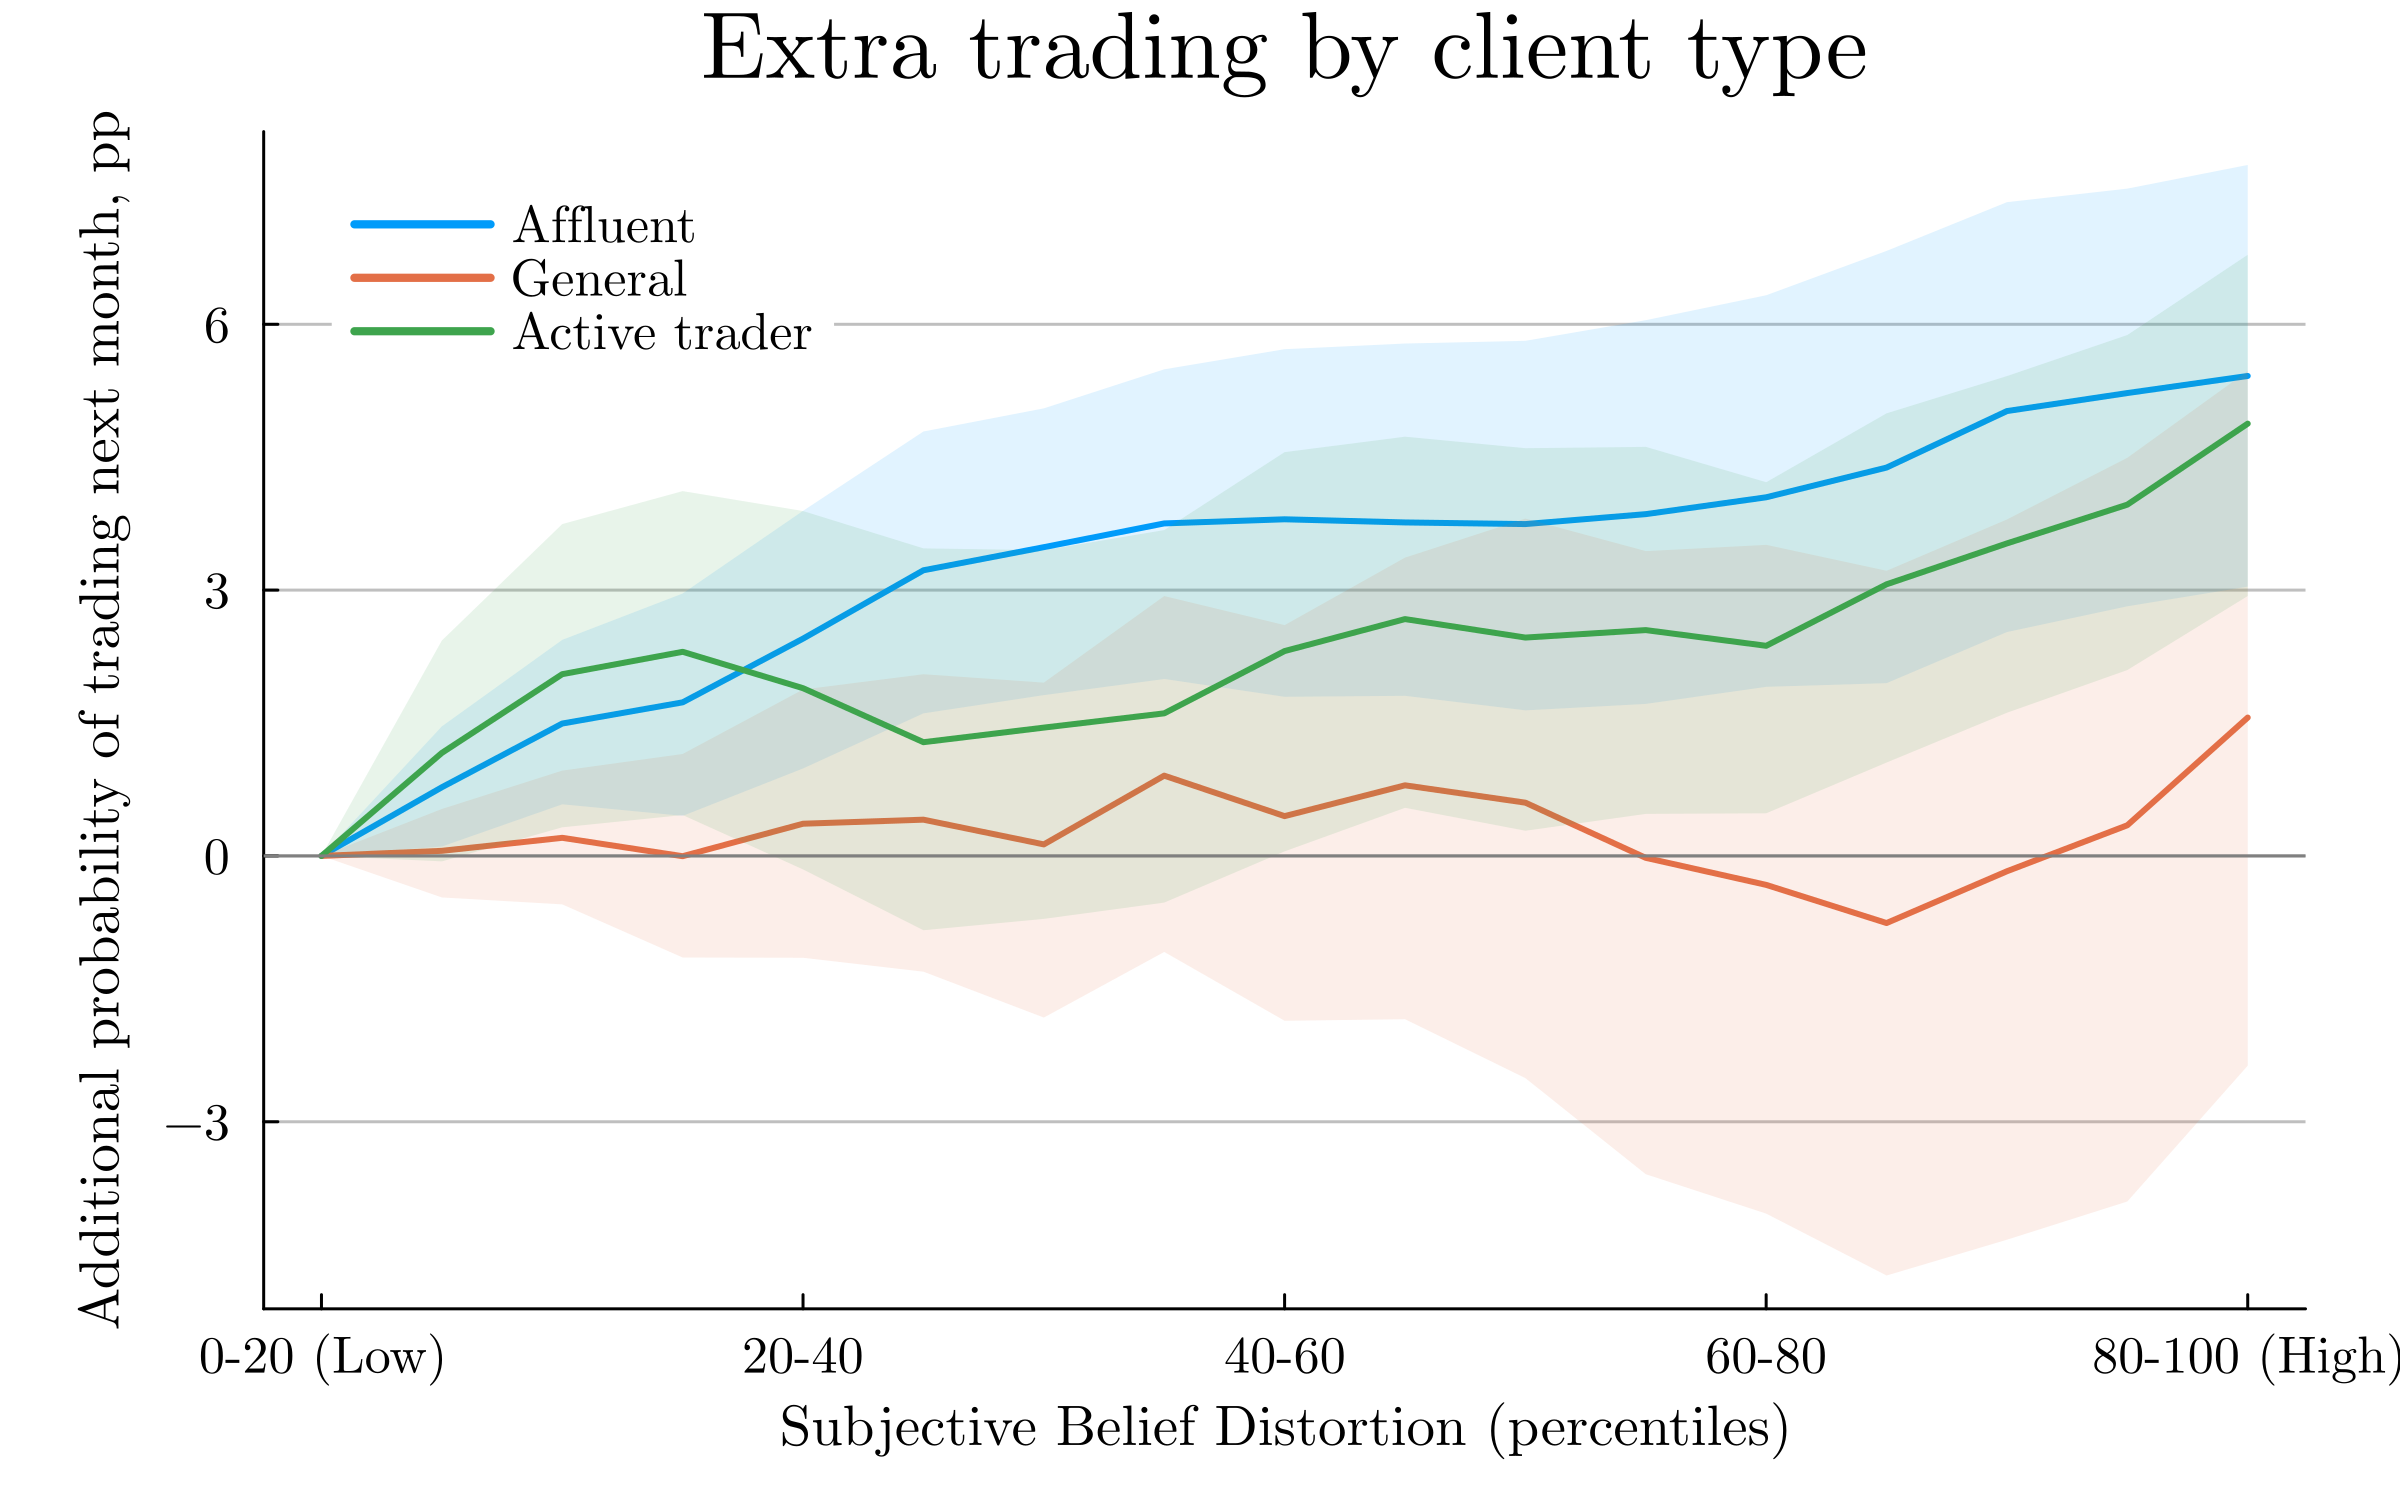
The more distorted the beliefs, the more they trade. 1 / 2Abstract
The average US household holds an under-diversified portfolio but surveys elicit beliefs about only the aggregate market. Using the portfolio holdings of a representative sample of US households, we recover their beliefs about both the aggregate market and their chosen portfolios. We show that: (1) risk aversion levels and beliefs exhibit persistent variation across households and over time, (2) beliefs disagreement manifests primarily in perceptions about expected returns and tail risk, (3) beliefs about own portfolios explain substantially better households' equity shares relative to beliefs about the aggregate market, (4) positive (negative) return ‘surprises’ lead households to increase (decrease) their risky share due to extrapolative beliefs, and (5) beliefs distortions explain the timing of trades and the cross-sectional heterogeneity in investment performance across households.
Work in Progress
-
Trading Without Investing: A Two-Stage Stock Market
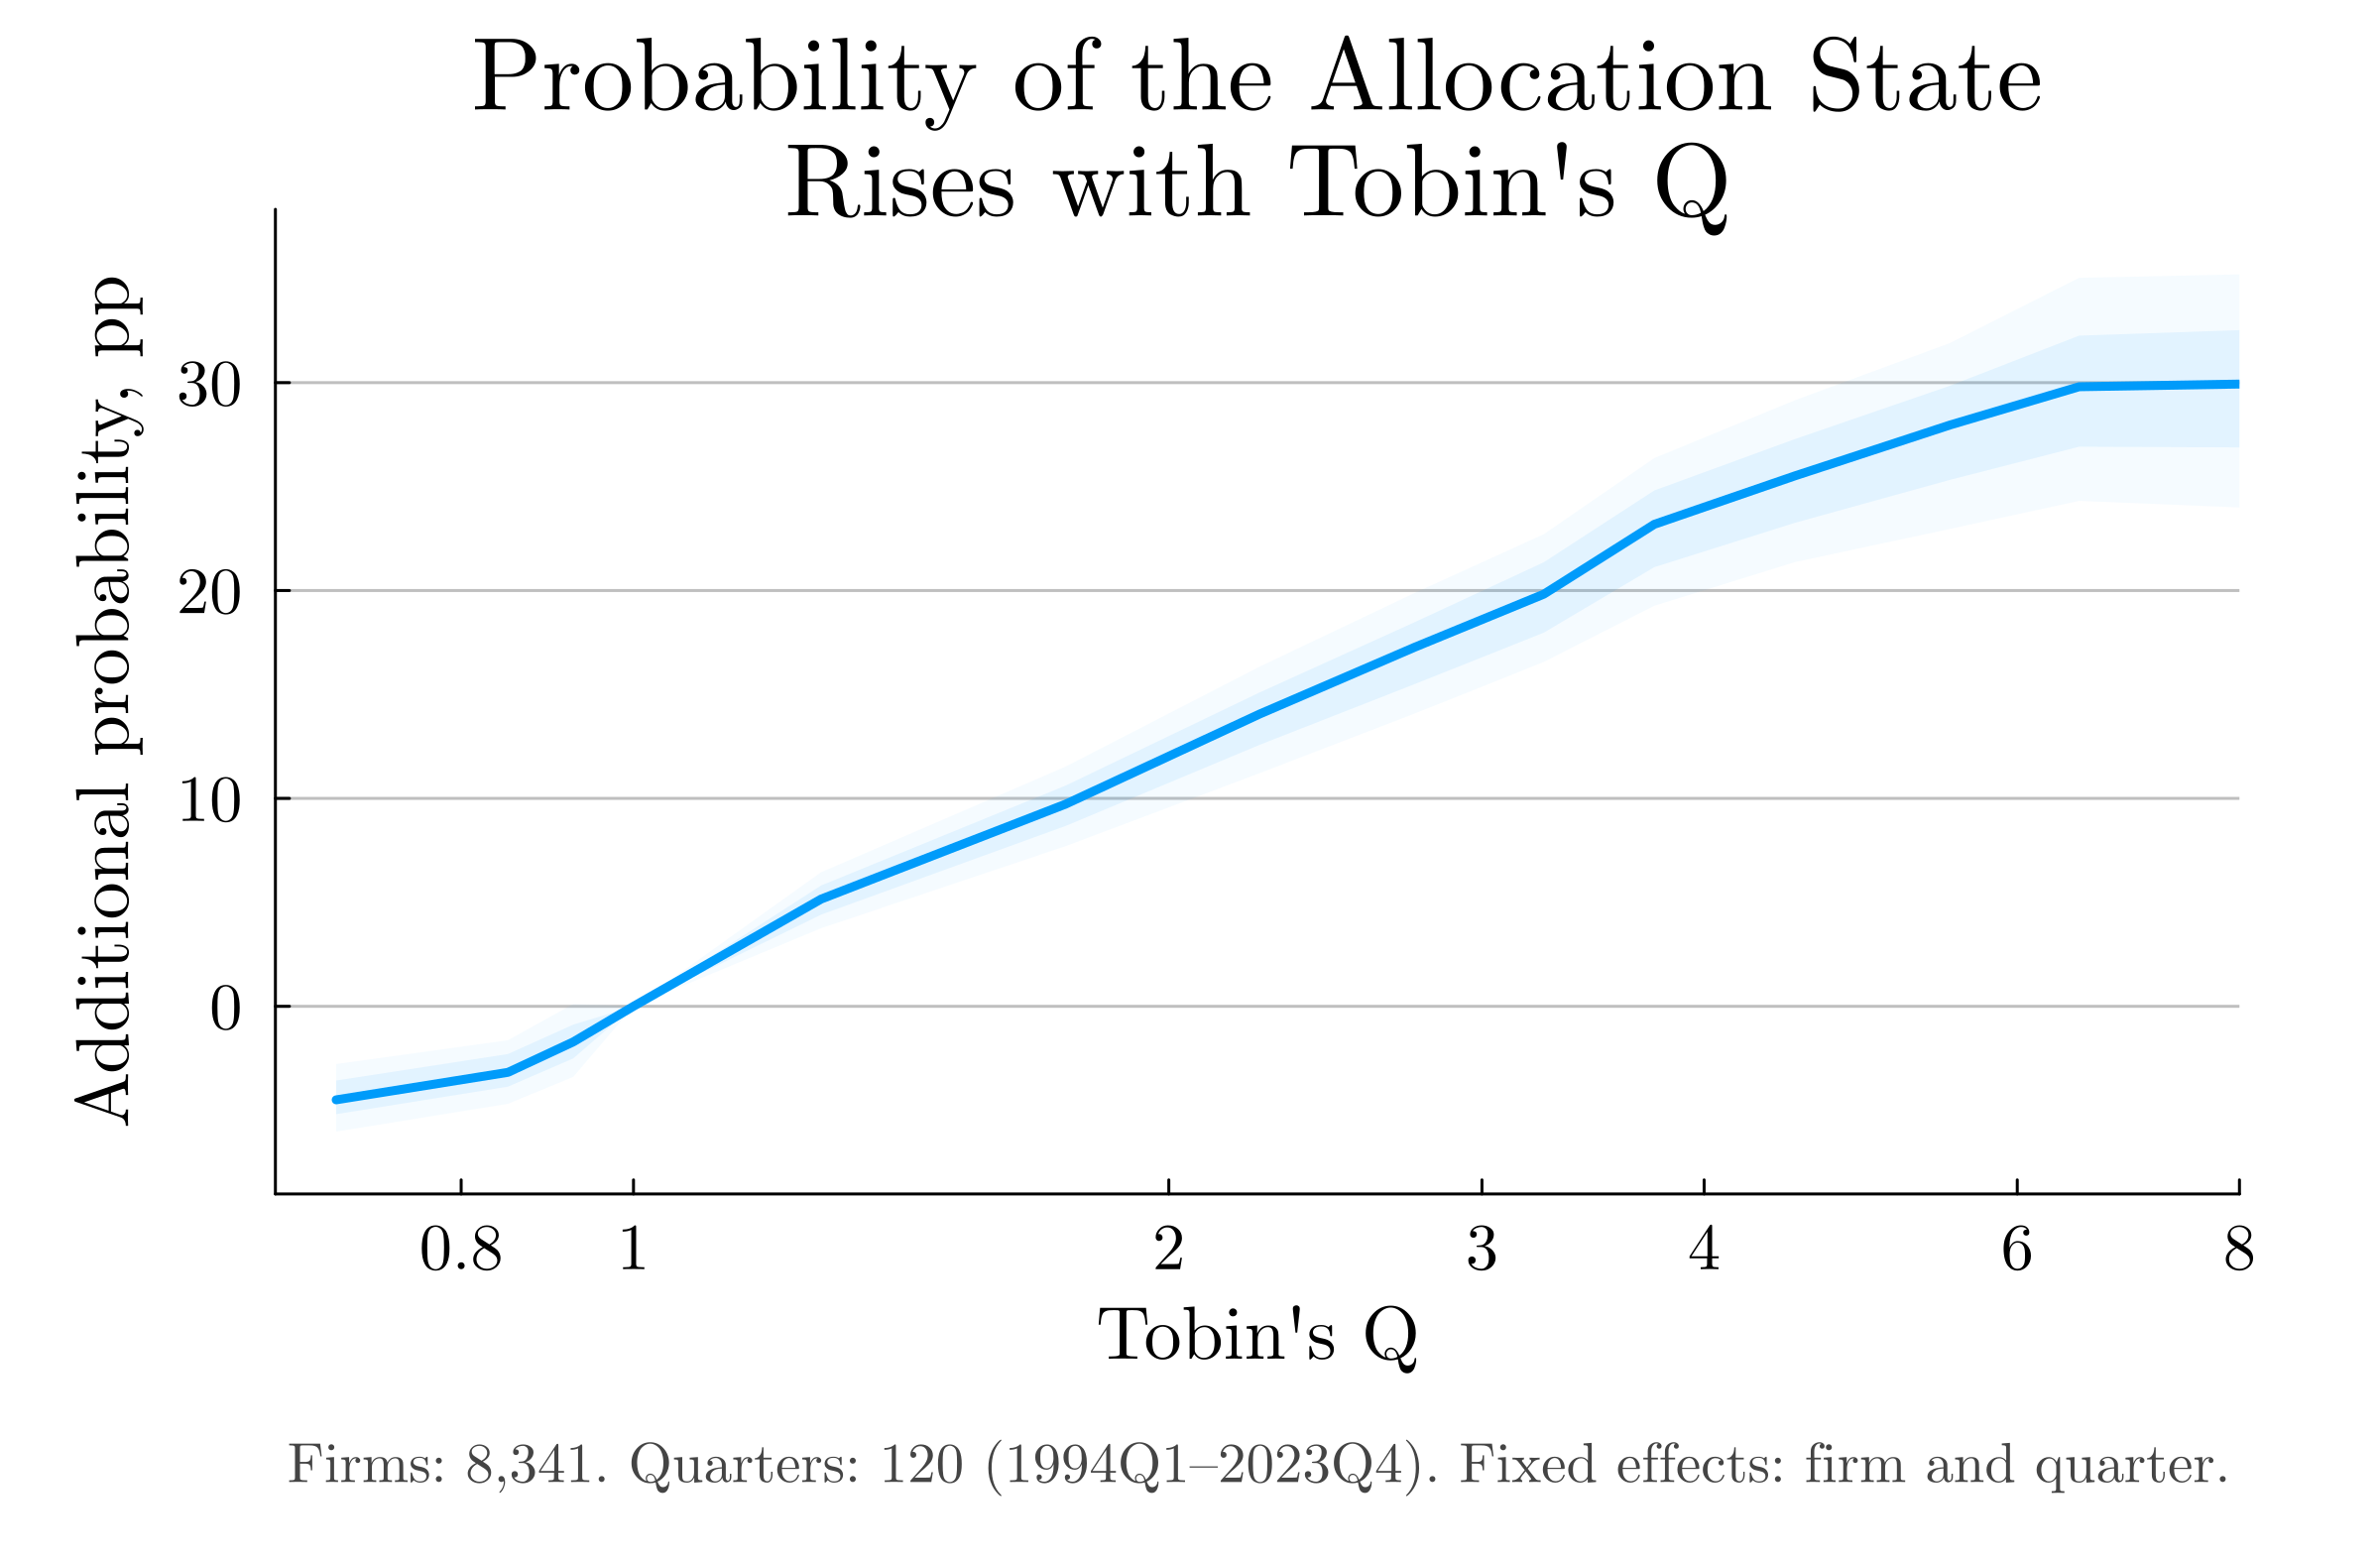
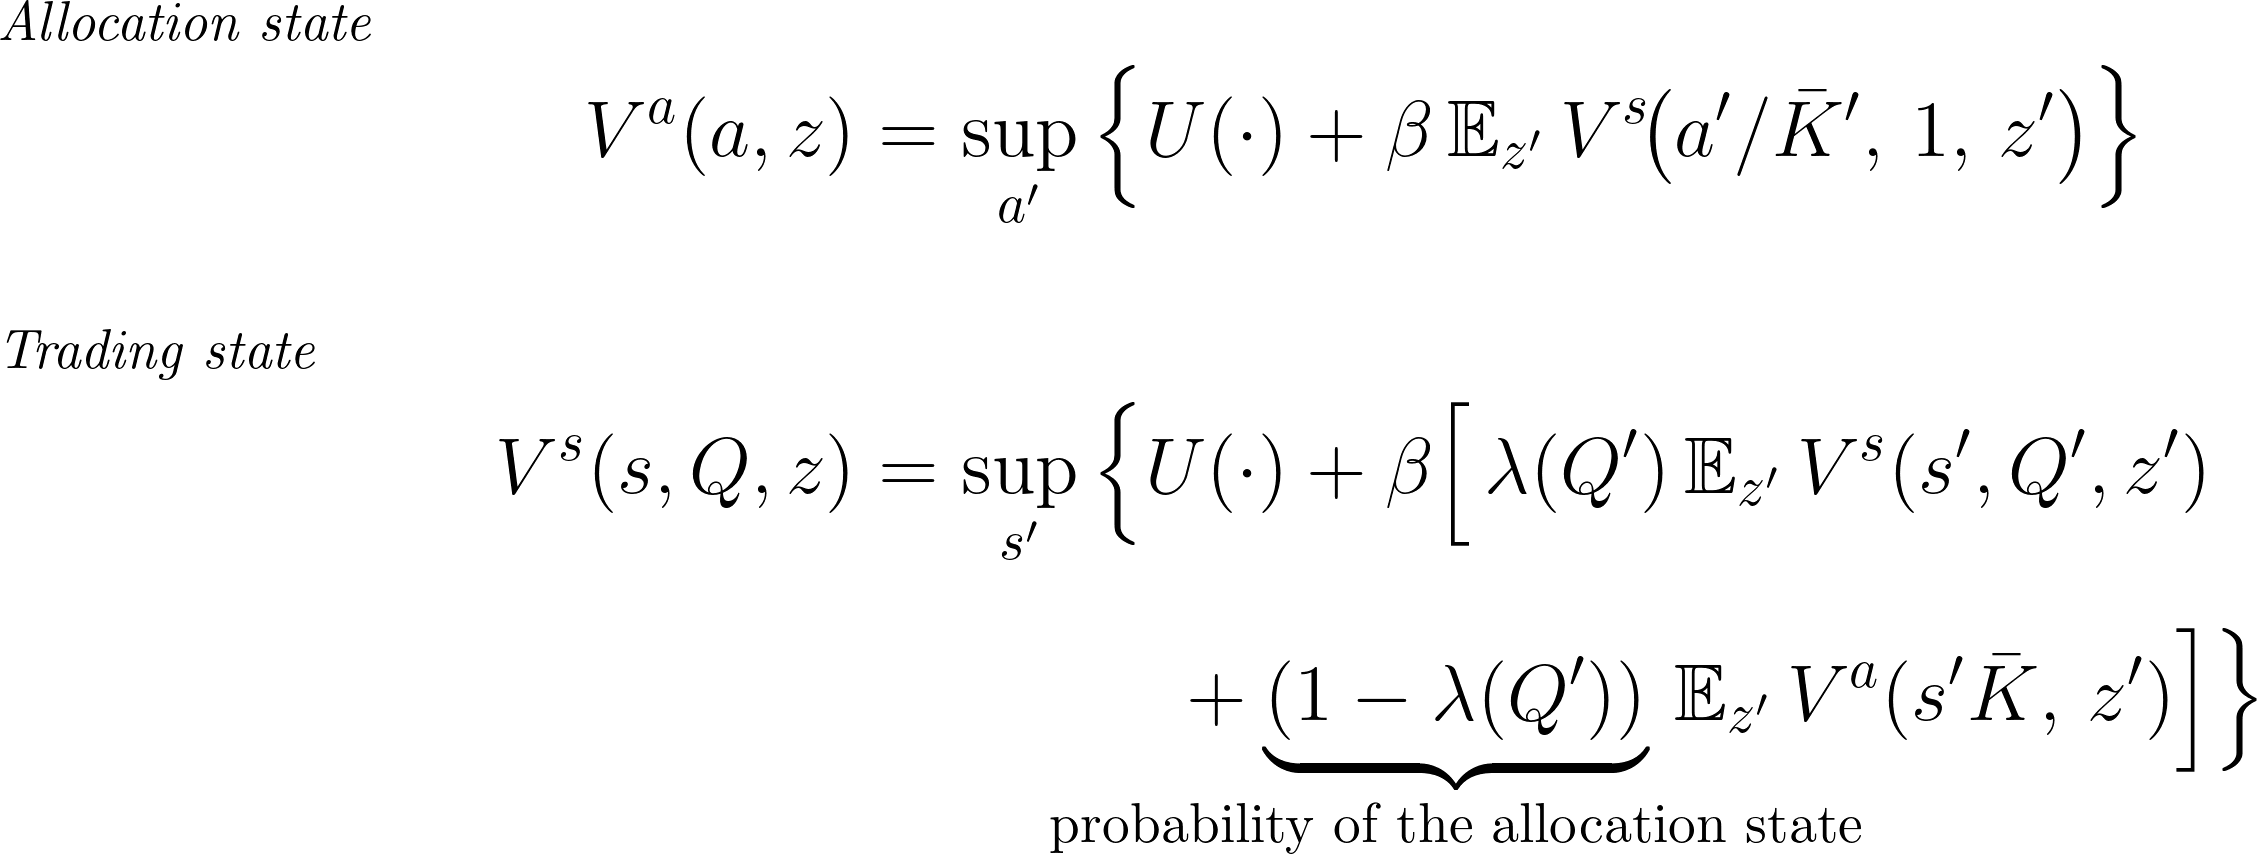
Probability of allocating capital into production rises with Tobin’s Q. 1 / 2Abstract
I introduce a two-stage stock market into macro-finance models. In most of these models, the stock market is not a separate object: capital adjusts immediately, so demand shocks for stocks are absorbed by capital rather than by prices. The two-stage market breaks this link: in the trading stage agents trade shares while capital is fixed, so prices absorb the shock; capital adjusts only when the economy enters the allocation stage, with probability proportional to Tobin’s Q above one. This mimics real stock markets, where firms issue or repurchase equity only occasionally. Three results follow. First, the stock price becomes an object on its own, so the effect of a shock on the market can be separated from its effect on production. Second, prices move before capital, which generates excess volatility relative to dividends. Third, the model reproduces the pattern of excess stock market reactions to monetary and fiscal stimuli: prices jump and revert while dividends and capital are unchanged. Absent aggregate shocks, the stationary equilibrium coincides with that of the underlying model, so the market can be added to existing models without changing their steady state.
-
How Far Back Do Investors Look?
Presentations McGill PhD Conference 2025
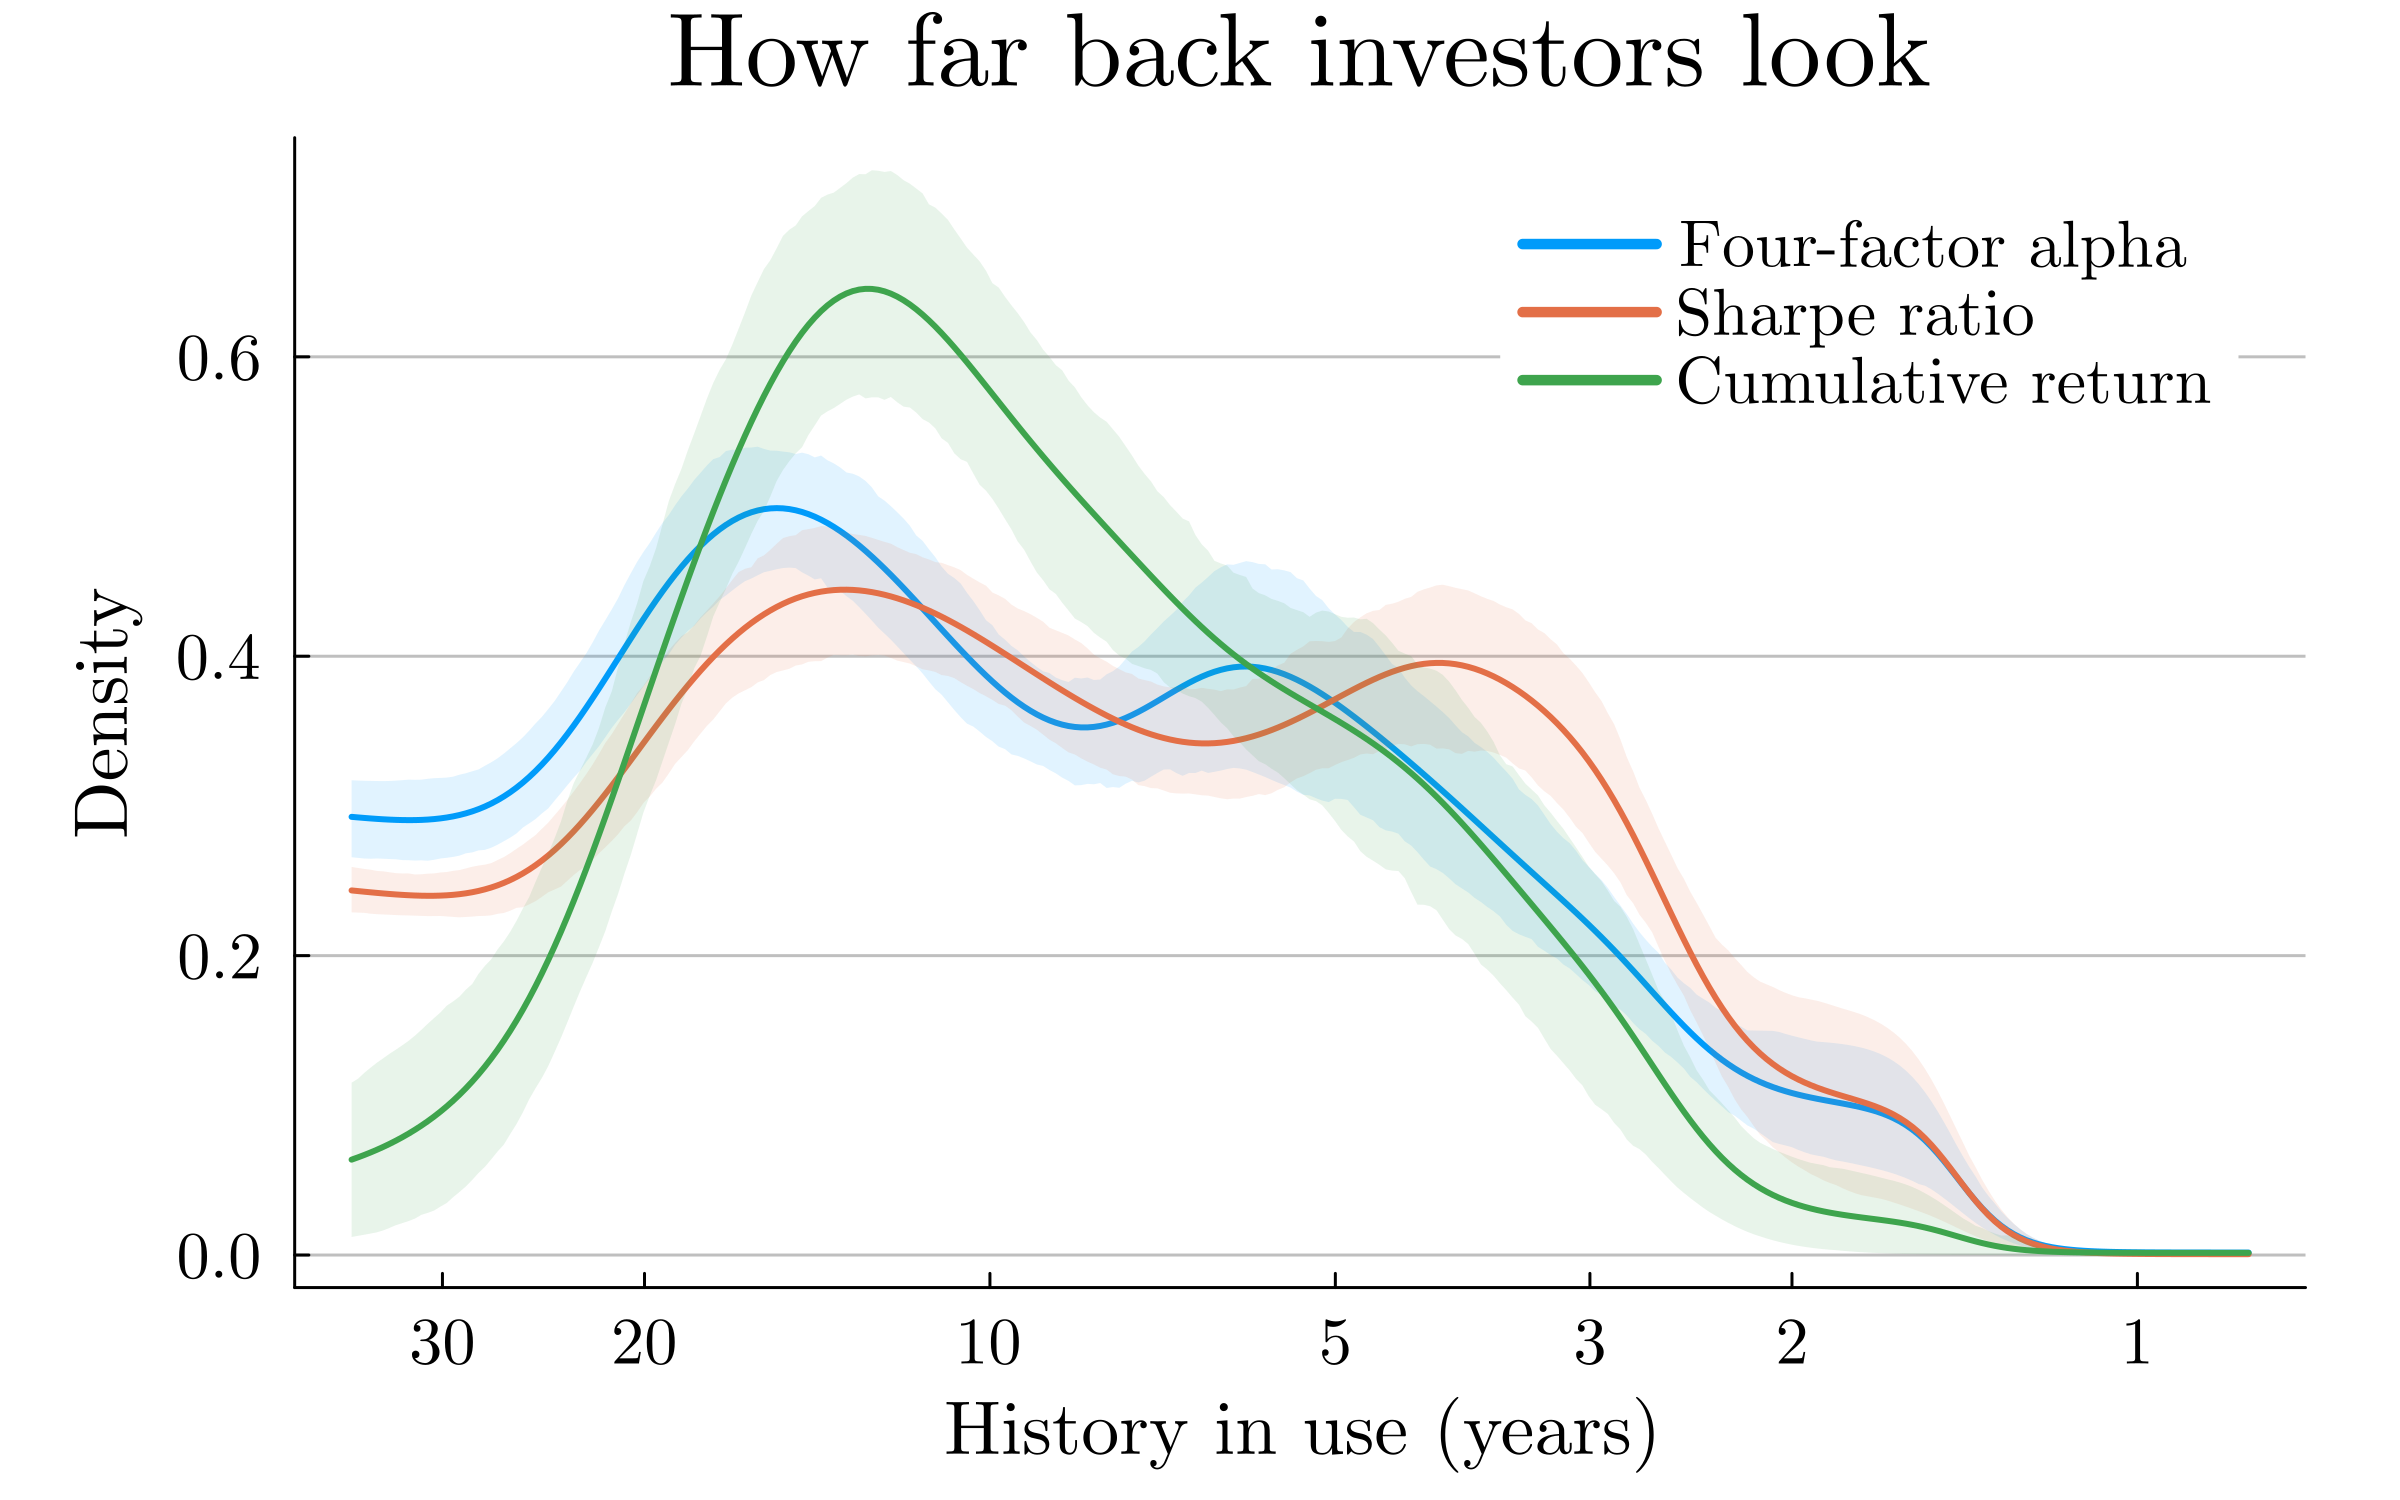
Length of return history investors use, by performance measure. 1 / 2Abstract
How far back do investors look when they decide whether to invest? I answer with the monthly statements of more than 100,000 accounts at a discount broker from 1991 to 1996. I calculate each performance indicator over windows ranging from one to thirty years and compare how well the resulting indicators explain investors’ decisions to trade. The performance measure is a four-factor alpha, the Sharpe ratio, and the cumulative return. The result is an estimated distribution of the windows, the lengths of past information in use. Investors look back ten to twelve years on average, and windows covering only the most recent one or two years receive little weight for any measure. Risk-adjusted measures have more mass than cumulative return at windows of up to eight years, consistent with the additional information they provide about risk. The results show heterogeneity across investors: active traders use shorter windows than general clients.
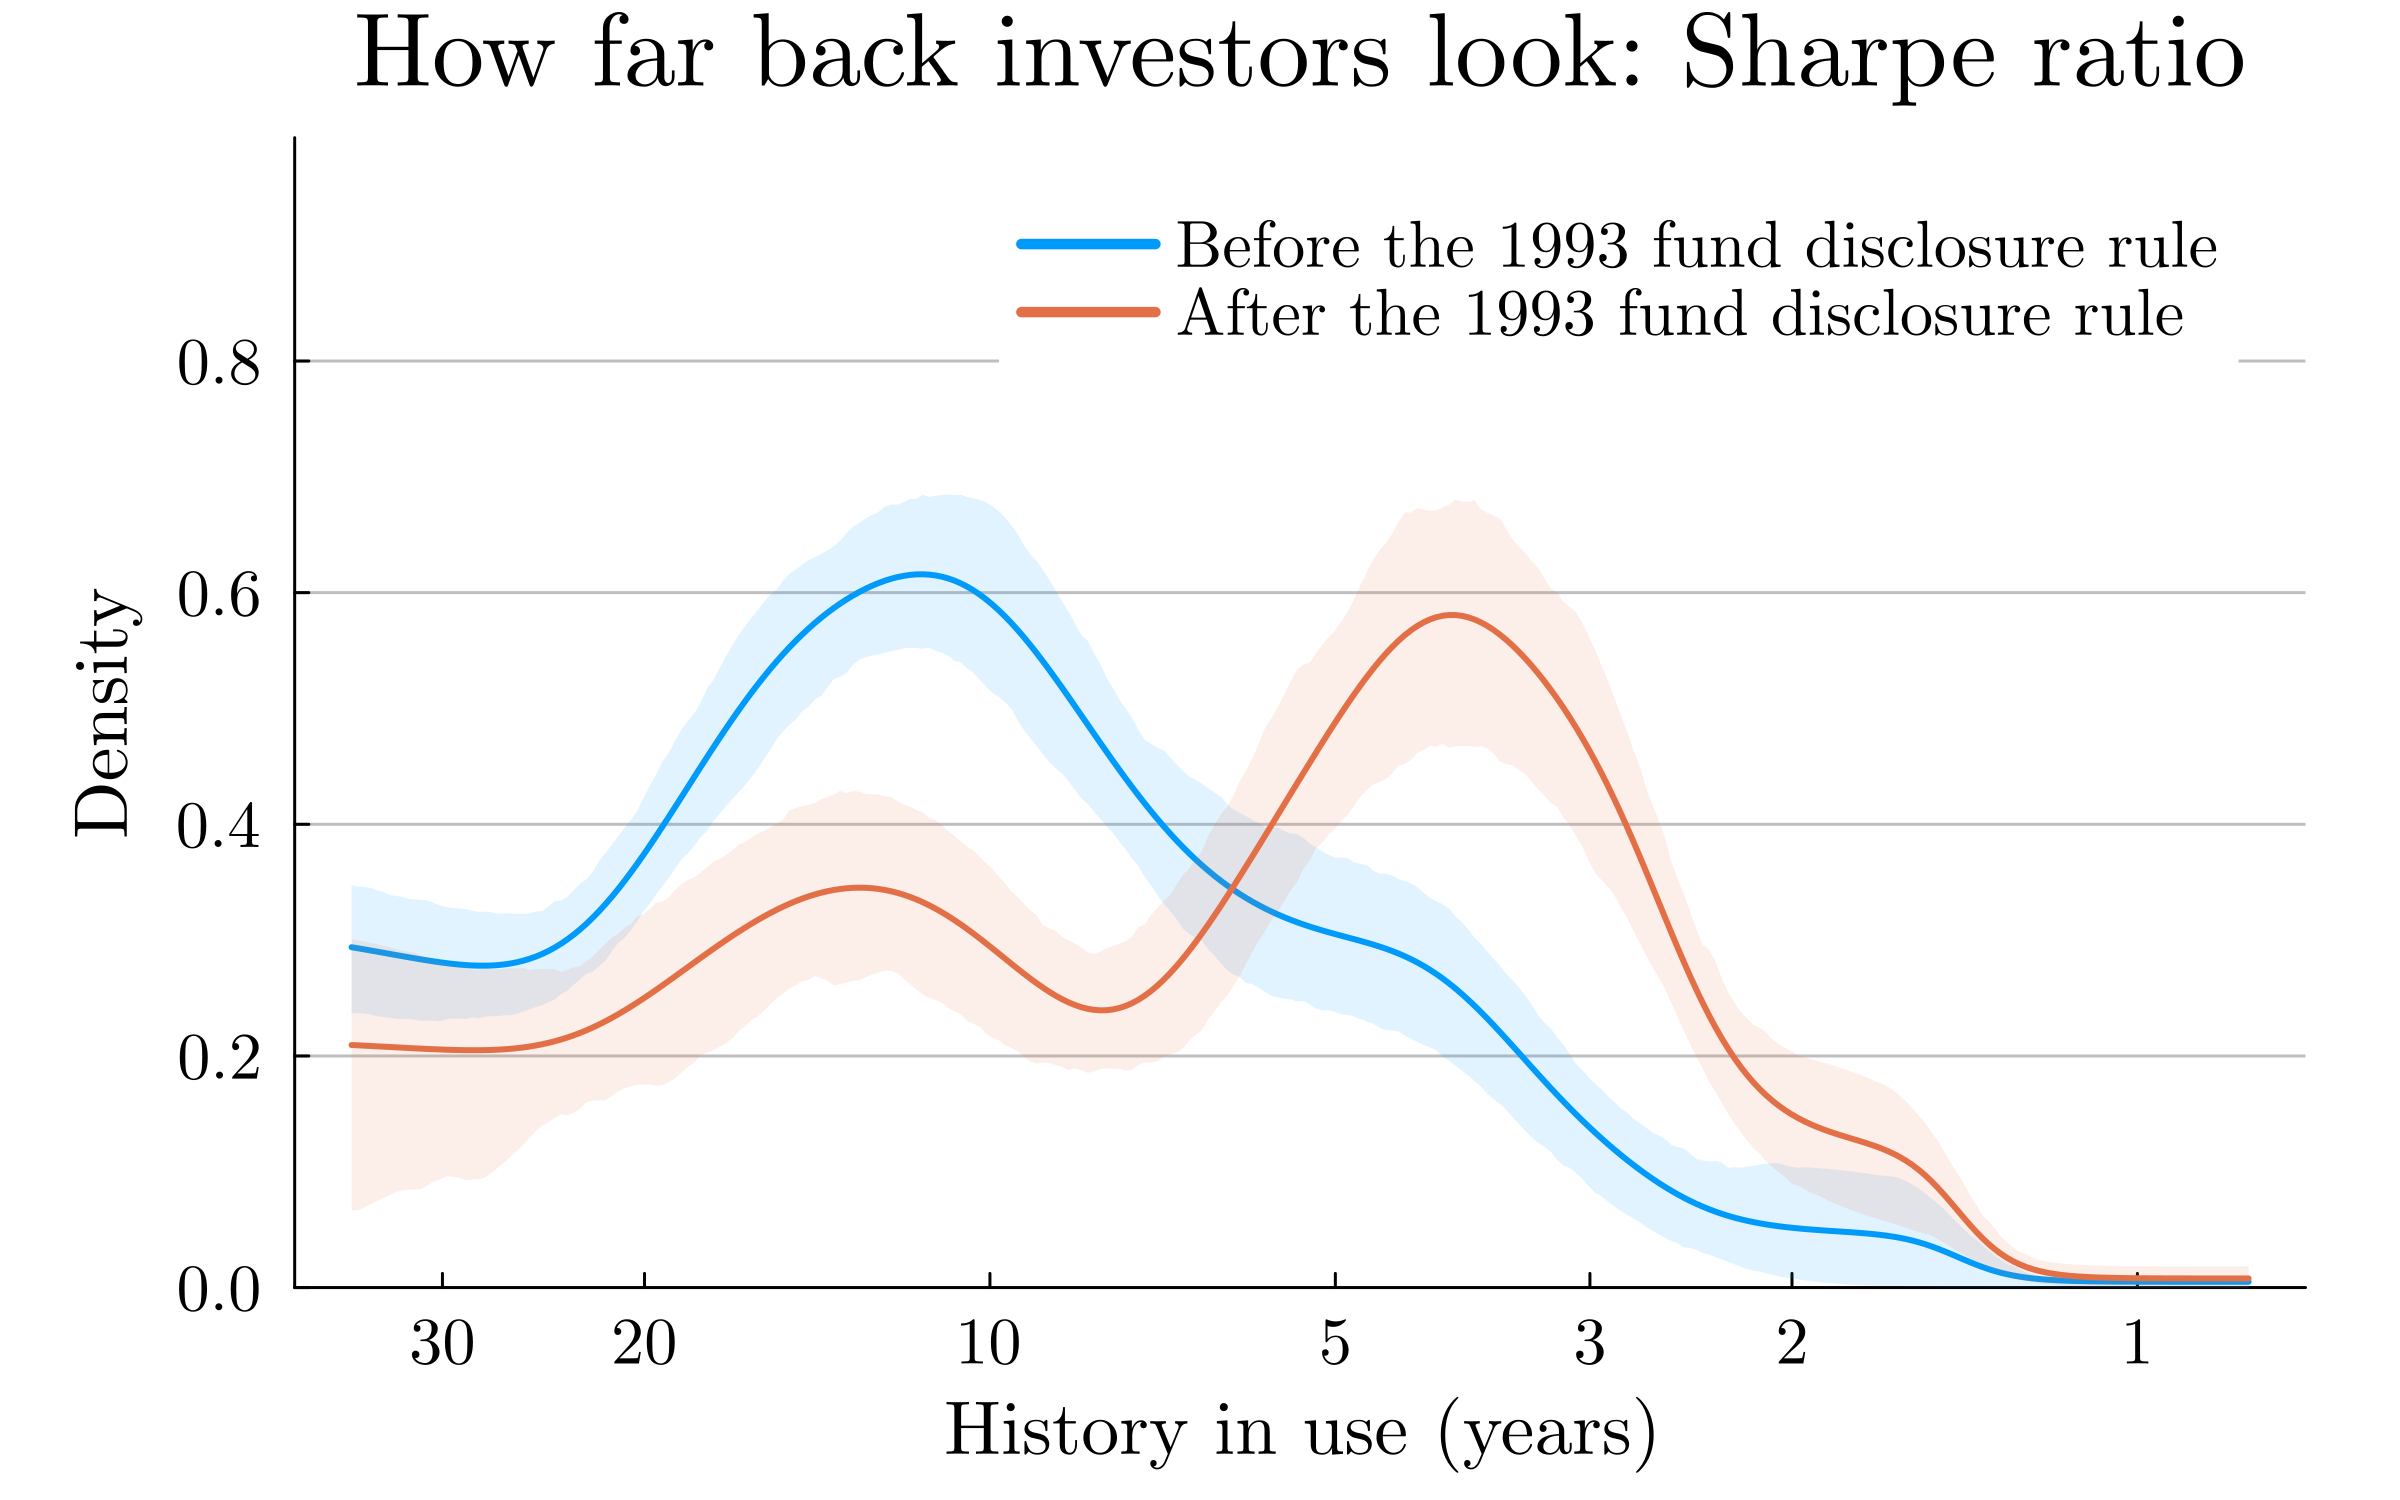
The window also depends on what investors can see. In 1993 the SEC required mutual funds to report returns in one standard form, with a ten-year line against a market index. After that year the window for the risk-adjusted measures shortened: the mode for the Sharpe ratio fell from eleven years to four, and the probability of using five years or less rose from 0.2 to 0.5. This pattern is consistent with investors using newly available information about risk-adjusted performance in their trading decisions. In contrast, cumulative return, which needs no such information, kept its mode.
Other publications in refereed journals (223 citations): Google Scholar.
Teaching
Lecturer
- The Firm in the Macroeconomy MGCR 294
- Financial Econometrics MATH 60210
- Macroeconomic Analysis
- DSGE Modeling with Dynare
Teaching Assistant
- The Firm in the Macroeconomy MGCR 294
- Financial Derivatives FINE 448
- Investment Management FINE 442
- R for Investment FINE 496